

summary:
A new national war intensity assessment system and an alliance war intensity assessment system have effectively reviewed and validated a series of predictions published online in April and May 2022. These predictions about the trajectory of the Russia-Ukraine war were completely unbelievable and unacceptable at the time, but were confirmed by the course of the war a year later, and also supported by this new war capability assessment system. Those predictions from a year ago indicated that the Russia-Ukraine war would be confined to the L1 and L2 lines for a long period; that Russia would establish as many as seven autonomous governments on Ukrainian territory; and that Russia would not suffer a military defeat until at least the end of 2026. In this war capability assessment system, geographical factors, demographic factors, organizational capabilities, military capabilities, and economic capabilities are listed as the most important war capability assets. Geographical factors, in particular, have been elevated to a previously unrecognized level. It is considered the most powerful deterrent component of a nation. According to this war capability assessment system, the nations with the strongest overall war capabilities are: China, the United States, Russia, India, Brazil, Canada, Australia, Saudi Arabia, Japan, and Indonesia. According to the extended calculations of this assessment system, the current Ukrainian coalition’s overall warfighting capability is weaker than that of the Russian coalition. This is the fundamental reason why Ukraine is constrained in the war in central and southern Ukraine. The model also speculates that if Russia attempts to advance westward beyond the L1 line, it will almost certainly trigger an upgrade and renewal of the Ukrainian coalition. The upgraded Ukrainian coalition would be significantly stronger than the existing Russian coalition, potentially leading to Russian setbacks in central and southern Ukraine. However, the eastward advance of the new Ukrainian coalition would almost certainly not extend beyond the east of the L2 line. This is because once the front line crosses east of the L2 line, it would trigger an upgrade and renewal of the Russian coalition. The upgraded Russian coalition’s warfighting capability would again surpass that of the Ukrainian coalition, resulting in another reversal of power.
Keywords:
National war intensity, Russia-Ukraine war, alliance war intensity
Just two months into the Russo-Ukrainian war, predictions that were abhorrent to Westerners and bordered on the fantastical emerged. These included: “The Russo-Ukrainian war will be confined to the area between the Dnieper and the Donbas”; “Russia will be invincible”; “Russia will not experience a military defeat until at least 2026”; and “Russia will establish about seven local autonomous governments on Ukrainian soil” [1,2,3,4]. These predictions remain extremely disliked by Westerners. Unfortunately, however, they are gradually becoming reality.
Do these predictions have reliable supporting reasons or factual basis? After excluding emotional factors, can political science professionals consider the Russia-Ukraine war from another perspective?
Perhaps an assessment tool can now be used to examine that prediction that emerged last year—predictions that many rejected, found unbelievable, and abhorred, yet are becoming increasingly realistic. This tool is the “National War Intensity” assessment scale. It can also be extended to assess the war intensity of war blocs or alliances.
The following is the structure of this assessment table, which can be named “National War Intensity”.
I. Framework for Assessing National War Intensity:
1.1 Components of a National War Intensity Assessment System
- Territorial Expansion and Geographical Features: In this evaluation system, territorial area and geographical features are the most important assets for a nation to withstand the impact of a full-scale war. This single item accounts for 300 points. This factor is especially important now and in the future, given that the use of high-powered, wide-area weapons will become the norm in warfare.
- The text emphasizes the significant influence of population factors on the final outcome of war. It accounts for 100 points (130 points in the evaluation of national groups or war alliances). As large-scale and comprehensive wars become increasingly commonplace, this factor will significantly impact the course and outcome of wars.
- A nation’s organizational capacity is a crucial factor influencing the course of war. It accounts for 90 points. When other military and political factors are roughly equal, a nation’s organizational capacity can significantly impact the probability of victory in a campaign or even a series of campaigns.
- A nation’s existing war assets and capabilities are also important components influencing its war-fighting capabilities. Their importance is particularly pronounced in short- to medium-range wars, as well as in the early stages and early phases of a protracted war.
- The most important factor determining the outcome of a war is a nation’s economy and production capacity, accounting for 350 points. Industrial production capacity is particularly important, accounting for 110 points; agriculture accounts for 80 points; the service sector accounts for 40 points; and the ability to sustain military spending accounts for 120 points.
- National history and war technology can exert an appropriate influence on the course of war.
- The defensive effect in war. Countries that enter a defensive state can generally quickly enter a total war mode; continuously improve the effectiveness of war; better utilize the war effects of geographical factors; have a political environment that allows them to take the lead in raising the level of war; and are more likely to be tolerated by the real world and by historical records when using extreme means of war.
| Table 1: National War Intensity Assessment Items | |||
| Geographical factors: 300 points | land area ratio | Key evaluation factors | High-powered, wide-area weapons are the most powerful force for a nation to withstand the impact of war in real-world applications. |
| Geographical features | Reference coefficients in the evaluation | The complexity of a country’s geographical features increases its ability to withstand the impact of war. | |
| Political factors: 320 points | Population factors
100 points |
population ratio | The actual operational unit of a nation’s participation in war; the main counting unit that bears the impact of war; the counting basis for national recovery after war. |
| Labor force ratio: | In a state of war, the actual capacity to support a nation’s political, economic, and military activities. | ||
| Percentage of the dominant ethnic group: | Key factors for sustaining war-fighting capabilities, organizational capacity, and political stability under the brutal impact of war. | ||
| Organizational ability
90 points |
Centralized power: | The peacetime organizational model of a state reflects its ability to respond to war. | |
| Stability: | The degree to which citizens approve of the state structure during peacetime reflects their ability to follow the state’s policies. | ||
| National History
10 points |
10 points for historically leading world superpowers | National historical honors can appropriately enhance the public’s resilience to war. | |
| Historically or currently, regional powers receive 5 points. | The pursuit of national honor and leadership can appropriately enhance a nation’s resilience to war. | ||
| Military Structure
120 points |
Mathematical models calculate the ranking of existing military forces of various countries. | It generally acknowledges the rationality of national military strength rankings and recognizes that existing military assets have a significant influence on both the conduct and outcome of wars. | |
| Economic factors: country score 380 points
War Alliance: 350 points |
Agricultural productivity: 80 points | Agricultural GDP and the Global Food Security Index are the main indicators used in the calculation. | Primitive and traditional agricultural production capabilities were the most important background against which a nation was isolated and alone under the pressure of war. |
| Industrial productivity: 110 points | National industrial GDP and national innovation index are the main calculation indicators. | Industrial production capacity is the decisive factor for a country’s sustained investment and expenditure in war; it is the main means and primary capability for a country to win wars. | |
| Service industry capability (40 points) | The service sector is the main indicator for GDP calculation. | The capacity to serve production must be transformed into support for war operations through certain methods during wartime. | |
| Military spending capacity: 120 points | Peacetime military spending capacity can fundamentally determine a country’s ability to sustain military spending. | A nation’s capacity to invest in military spending reflects its long-term comprehensive ability to develop war assets. | |
| Military Technology (30 points) | High-tech warfare can bring considerable war benefits in short-term wars or in the early stages of a war. | ||
| State of war | Defense effect coefficient | 2.2 | War intensity coefficient of the five permanent members of the UN Security Council in a defensive war |
| 1.8 | War intensity coefficient for a defensive war waged by an “uncertain nuclear-armed state”. India, Pakistan, Israel, Saudi Arabia, North Korea. | ||
| 1.4 | The intensity coefficient of war when other countries are waging a defensive war. | ||
| Table 2: Weapon Technology Rating Table | |||
| Military high technology | Long-range projection technology
9 points (Score will be awarded based on the highest score) |
Weapon range > 10K km | 9 |
| Weapon range > 5,000 kilometers | 7 | ||
| Weapon range > 3,000 kilometers | 5 | ||
| Weapon range > 1,000 kilometers | 3 | ||
| Flight Technology
7 points (Score will be awarded based on the highest score) |
Hypersonic vehicle manufacturing | 7 | |
| Stealth fighter manufacturing | 5 | ||
| 4th generation aircraft manufacturing | 4 | ||
| Manufacturing of 3rd generation light fighter jets | 3 | ||
| Drone manufacturing | 2.5 | ||
| High-altitude action technology
7 points (Score will be awarded based on the highest score) |
Space or near-space stay | 7 | |
| Satellite navigation capabilities | 5 | ||
| Weather/Image Satellite Capabilities | 4 | ||
| Other 24-hour loiter capabilities | 3 | ||
| Conventional weapons technology
7 points (Score will be awarded based on the highest score) |
Aircraft carrier manufacturing | 7 | |
| Manufacturing of conventional bombs with a yield of 1,000 tons or more | 7 | ||
| 7K-ton warship manufacturing | 6 | ||
| Manufacturing cruise bombs with ranges exceeding 800 kilometers | 6 | ||
| Manufacturing air-launched bombs with ranges exceeding 500 kilometers | 6 | ||
| 3K-ton warship manufacturing | 5 | ||
| Main battle tank manufacturing | 4 | ||
| Light and medium tank manufacturing | 3 | ||
| 1K-ton warship manufacturing | 3 | ||
| Manufacturing of projectile weapons with a range of over 30 kilometers | 2 | ||
1.2 The importance of land area and geographical features.
1.2.1. The application of high-powered and wide-range weapons is increasingly becoming a military reality.
(1) Countries around the world are investing heavily in the research of high-yield bombs. Among conventional weapons, conventional weapons with a yield greater than 1,000 tons of TNT are nearing success; the application of high-yield conventional weapons is increasingly becoming a military reality.
(2. Thirty-five years after the Chernobyl nuclear accident in the Soviet Union, the world’s fear of nuclear leaks has gradually decreased. This reality has reduced the ethical constraints on the use of military nuclear devices;)
(3. Following the Fukushima nuclear disaster in Japan, the international community has been extremely tolerant of the discharge of nuclear contaminants. This has further lowered the ethical threshold for the use of low-yield or even medium-yield nuclear weapons;)
(4. The miniaturization and practical application of low-radioactivity nuclear weapons has increased the likelihood of using nuclear devices in overall warfare;
1.2.2. High-powered, wide-area weapons have become a practical political tool for Russia and other countries.
(1. Russians, whether from the perspective of national origin, cultural attributes, or philosophical thinking, define themselves as Europeans. In recent years, in the cultural war, under the guise of being “civilian,” “popular,” “non-governmental,” and “spontaneous,” a large number of online media outlets have repeatedly emphasized that Ukraine is the largest country in Europe. This cultural process is a typical cultural war aimed at expelling Russia from Europe culturally (and even philosophically). In this war, Russia has almost no ability to resist.)
(2. The inevitable outcome of the war in Ukraine is the establishment of a solid “Ukrainian trench”[3]. This trench will effectively drive Russia out of Europe politically and economically. Without a war that completely dismantles Europe, Russia will not be able to completely reverse its disadvantage in the next 50 to 100 years.
(3. The protracted war in Ukraine is an attempt to weaken Russia’s presence in Europe both economically and militarily. This is a real, ongoing process in which Russia is also at a disadvantage.)
(4. Russia is clearly at a disadvantage in the face of the comprehensive and multi-layered offensive by the US bloc.)
(5. Defending the European identity of Russians is something all Russians must do. This involves the cultural foundation and philosophical attributes of the Russian nation. High-powered, wide-range weapons have become a political tool they have to use. This choice cannot be avoided. It is impossible to solve political and philosophical problems through moral means.)
(6. Other countries are increasingly viewing nuclear options as a viable means to protect their political structures and national interests. The issues of Israel, India and Pakistan, North Korea, and Iran all revolve around this theme. Nuclear arms control will only become more difficult, not easier.)
1.2.3 The overall war model of a nation or group of nations has returned to political reality.
Currently, the United States cannot handle or confront challenges from Russia, China, or the Arab world alone. The model of resolving political disputes on a national bloc basis has become a de facto political reality. When a national bloc engages in a war, the vastness of its territory and geographical diversity become crucial factors in a nation’s war-bearing capacity and the final outcome of the conflict.
It cannot be ruled out that a power center might peacefully relinquish leadership. However, more commonly, power transitions occur under intense pressure. The confrontation between a powerful old leadership core and a powerful emerging force often takes the form of an armed group.
1.2.4 Historical lessons.
During World War II, Russia used its territory and climate to halt the German advance, despite Germany possessing the most advanced weaponry and warfare tactics.
The Channel’s topography protected Britain. Vast territories protected the Soviet Union and ultimately saved Europe. Meanwhile, the ‘advanced and powerful’ military powers of Northern and Western Europe could not stop the rapid advance of Nazi Germany.
The hilly and mountainous terrain of southwestern China hindered the Japanese advance during World War II and depleted the vast majority of Japan’s armed forces. This was despite Japan being an industrialized nation while China was still in an agricultural stage, and despite the significant technological and productivity gap between the two countries at the time.
1.2.5 A vast territory is the most powerful strategic deterrent force.
Under the impact of high-yield, wide-area weapons, or in a rapid military maneuver, small countries can quickly lose their war-fighting capabilities, and even their national production capacity.
A vast territory is a nation’s most powerful asset in the face of high-yield, wide-area weapons strikes. Strategically, a vast territory is the fundamental support for a country to rapidly escalate a war to its highest level. It is also the basis of deterrence against an adversary’s attempt to “escalate the war.” Therefore, a vast territory is, in fact, a nation’s most powerful strategic deterrent force.
1.3 The importance of population factors in the reconstruction of order.
1.3.1 Period of global disorder.
It is clear that the existing world power system is experiencing difficulties. The United States, which maintains world order through its costly maritime system, is finding it increasingly difficult. Countries challenging the United States, including Russia and China, primarily seek to gain national interests by challenging American authority. Simultaneously, they are unwilling to assume the responsibility of managing a costly world order. The United States, on the other hand, faces the direct reality of a shrinking power balance. Once the United States voluntarily relinquishes its governing responsibilities, or is forced to do so, the world will completely lose its power balance and enter a state of chaos.
1.3.2. The period of philosophical model exploration.
It is quite clear that the Chinese are unwilling to assume global power using the old, expensive system. Furthermore, they cannot function this system without fully seizing economic and financial decision-making power. Finding a widely accepted new philosophical model to establish a new world order will not be a costly process. Often, this process relies on a near-devastating war. Historically, periods of chaos with population declines exceeding 70% are not uncommon. In prolonged periods of chaos, population becomes one of the most crucial factors determining ultimate victory. In China’s long history of warfare, the side most successful in capturing population often becomes the ultimate victor.
In fact, the population pressure from barbarian tribes is considered by many historians to be an important reason for the collapse of the Roman Empire.
1.3.3. Historical Review and Current Outlook:
As early as April to June of last year, predictions pointed out that Ukraine would have to rely on the human resources or armed forces of its allies to sustain the war [2, 3]. Increasingly revealed facts have confirmed this reality. With its population further declining, Ukraine faces the risk of losing all its territory east of the Dnieper River. The US bloc can expect to win the Russo-Ukrainian war through an economic war of attrition, while Russia can expect to win through a war of attrition.
1.4 The importance of economic power.
1.4.1 War machines are ultimately manifested through their production capacity.
Economic power is the foundation for sustaining a war. And the war machine is primarily manifested through industrial production capacity. A nation’s industrial production capacity is especially crucial under harsh conditions of economic fragmentation and blockade.
In the history of warfare in ancient China, every large-scale war was a process of mutual economic and human resource depletion. Even the victor in a large-scale war would suffer enormous losses. Only countries with strong economic productivity and recovery capabilities were able to wage repeated large-scale wars. There are even many examples of countries that, despite winning wars, ultimately suffered overall defeat.
At its core, both World War I and World War II were economic wars. The economically stronger side still exploited the less economically stronger side.
A strong economy can withstand countless military defeats. But for a side that relies solely on military strength, a single major defeat can lead to utter defeat.
1.4.2 Historical Examples
The Han Dynasty, the second major unified dynasty in Chinese history, serves as a prime example. The fact that the side with weaker military power initially triumphed over the side with stronger military power initially relied on its robust economic recovery capabilities.
The establishment of the Ming Dynasty in ancient China is another example of economic power triumphing over military power. A group initially weak in overall strength focused on economic development. This relatively weak group, following the development path of “building high walls, stockpiling grain, and delaying the declaration of kingship,” eventually became the most powerful force overall, emerging victorious in a protracted war.
In the history of wars between Britain and France, many warring parties suffered defeats due to economic reasons, and some even voluntarily admitted defeat for economic reasons.
1.5 The appropriate role of military technology.
1.5.1 Upgrades in military technology will lead to upgrades in military models and military theories.
The essence of war is the pursuit (seizure, capture) of economic interests (long-term or medium-term goals). Any method or plan that contributes to achieving victory in combat, on the battlefield, and in the war will be pursued and applied to the maximum extent. The revolutionary role of high military technology is undeniable. Revolutionary advancements in weaponry often simultaneously bring about revolutions in military theory and military operating systems.
Since the introduction of bows and arrows into Chinese warfare, the form of warfare has entered an era of leveraging terrain and geographical advantages for victory. One side could ambush the enemy in mountains, through dead-end roads, and through valleys, trapping them and then using arrows to kill them remotely and non-contactly. With the maturation of artillery technology, Napoleon dominated Europe based on his military doctrine of artillery barrage. The invention of railways revolutionized the way armed forces were concentrated and transferred. Airplanes enabled humans to strike the enemy from the air. The installation of massive artillery on ships ushered in an era where sea power overwhelmed land power. The widespread application of medium- and short-range missiles combined with airborne information systems will inevitably restore the era where land power suppresses sea power.
1.5.2 High-tech weapons are not a guaranteed factor for victory
However, Korea, the most adept at manufacturing high-tech (archery) weapons, was the first of the six kingdoms to be conquered. Napoleon, too, quickly failed after losing his supply of ammunition and provisions. The most advanced and indestructible Tiger tank was defeated by the technologically inferior T-34 and Sherman tanks.
The bow and arrow, a high-tech weapon, replaced the spear as the primary decisive weapon approximately 1500 years after its invention. This was when it had become a highly effective, economical weapon with the highest return on investment.
Artillery and firearms, after nearly 200 years of waiting, finally and comprehensively replaced bows and arrows as the decisive weapons of war. The revolutionary VI and VII rockets, however, did not change Nazi Germany’s air superiority.
1.5.3 Economic efficiency is the fundamental attribute of a “decisive weapon”.
The true essence of weaponry lies in maximum range and minimum cost, not in advanced technology or power. Range comes from technology, and affordability from economic strength. But fundamentally, it’s about economics. Without affordable and economical weapons, it’s impossible to sustain a prolonged state of war and compete with other nations.
When the cost prevented the widespread use of bows and arrows, the decisive weapon in war remained the inexpensive spear.
When the cost prevented the large-scale deployment of muskets and cannons, the decisive weapons of war remained the inexpensive spears and bows.
When the cost of long-range artillery prevented its widespread use, the decisive weapon of war remained the inexpensive light infantry.
When the cost prevents the widespread use of modern medium- and short-range missiles, the decisive weapon in war remains a combination of inexpensive light infantry, tanks, and aircraft.
Once the economics (input-output ratio) of the “medium- and short-range missiles plus airborne information” combination exceeds that of the “aircraft carrier plus aircraft plus air-launched missiles” combination, the decline of aircraft carriers, fighter jets and bombers, and the decline of naval power will inevitably follow.
Even if a conventional bomb with a yield equivalent to 1,000 tons of TNT is successfully developed, it will not quickly become a decisive weapon until its cost is good enough for widespread application.
If the benefits of nuclear weapons are less than the costs of their use (combined political, economic, and military costs), it is certain that they will not quickly become the decisive weapon.
This is the fundamental reason why the national war intensity assessment system attached to this article only assigns 30 points to weapons technology.
1.6 The Importance of Organizational Capabilities
1.6.1 War is a product of genetic memory and collective needs
War memories, wartime needs, and group success—factors discussed as theories today—are, when traced back to their most basic causes, actually memory factors parasitic within biological genes. These traits are inherited from generation to generation, and are either activated or repressed under certain stimuli.
A certain plant, distributed across multiple time zones worldwide, can suddenly flower and suddenly drop its fruit at a uniform time. Some plants produce chemical or biological products to inhibit the growth of other special species. These characteristics are, in fact, acts of warfare employed by plants. Plants also gain the right to perpetuate their special species through such actions.
The vast majority of marine life relies on group strategies for survival. Organizational ability determines the continuation of species in small organisms. Group strategies are, in fact, also a group characteristic of warfare. Although individuals instinctively reject death, genes, through group strategies, allow a minority of individuals to choose death to ensure the continuation of a particular species.
1.6.2 Organizational capability is an important part of war memory.
(1. Organizational ability is a group need. It is also a crucial war capability. Organizational ability is a fundamental capability that determines the continuation of a species.)
(2. Species with super individual survival abilities can also play an important role in the struggle for survival. Lions and tigers are species with top survival abilities, and they can also exhibit super organizational abilities under certain conditions. Only the power of inherited war memories can make super predators give up the right to reproduce and the right to control food, and form a powerful group.)
The infamous Bad Boys pride of Africa demonstrated exceptional organizational skills and formidable fighting capabilities. After confirming the absence of a threat to their survival, the pride split. Later, when both split prides faced survival crises, the smaller groups regrouped to enhance their fighting and survival abilities.
1.6.3 Organizational capabilities can be stimulated, enhanced, or weakened by the environment.
(1. For humankind, organizational ability is a key capability for the survival and continuation of a group. Ancient China possessed an advanced agricultural civilization. This advanced agricultural civilization relied on strict adherence to the seasons and the time of year. The harvest of the following year had to be strictly in accordance with the planting plan. The predictable operational process and the predictable harvest quantity led to the ancient Chinese people’s support for centralized power. The more centralized the group’s capabilities, the more massive projects such as land reclamation, water conservancy, and river transport could be completed. The stronger the group, the greater its ability to cope with famine years and natural disasters through mutual relief.)
(2. Unlike Chinese agricultural civilization, Europe has long relied on hunting, fishing, and herding. This way of life involves too much randomness. Groups or communities cannot predict or control the food supply and survival security for the following year. Therefore, organizational capacity has an upper limit for European populations. It is a double-edged sword in Europe. On the one hand, large groups have a survival advantage in the process of plunder. At the same time, in the process of distribution, large groups are more likely to face existential crises. This puts European civilization in a philosophical paradox of pursuing both moderately strong groups and small groups and individualism.)
(3. Organizational capacity is significantly influenced by the environment. When the living environment is harsh, groups tend to evolve into larger groups and organizations. Once the survival risks are eliminated or improved, small groupism or individualism will flourish.)
Today, almost all developed countries are rife with anti-marriage and anti-birth sentiments. Many countries have population growth rates of zero or even negative. Early European immigrants to North America faced a severe survival crisis. Faced with this crisis, the group subconsciously chose a collective survival strategy. We can find a document recording the story of an Irish woman who pioneered North America. She raised as many as 37 children. This historical fact includes a complete record of the names of her family members (see the image above). This completely overturns the perception that white women are unwilling to have children.
(4. Organizational capabilities are certainly influenced by survival strategies. The Irish famine is the root cause of the current England-Ireland conflict. In comparison, ancient China experienced several similar famines. However, each such famine became a significant opportunity for the ancient Chinese to integrate and unite. The English have ruled the British Isles for nearly 1000 years, yet they still cannot resolve the distinctions between the English, Welsh, and Irish. The reason for the starkly different outcomes despite similar starting points lies in the fact that powerful core groups chose different survival philosophies and paths at crucial moments.)
1.6.4 This assessment model has obvious shortcomings in assessing organizational capacity that cannot be resolved at present.
This assessment model clearly has unresolved shortcomings in evaluating organizational capacity. The main reason is its inability to accurately incorporate factors such as national history, survival philosophy, ethnic structure, linguistic composition, and religious differences. Further work may be needed when dealing with multi-ethnic countries like India. We need more existing research data combined with more in-depth mathematical models to more accurately assess their national cohesion and war-fighting capabilities. We look forward to future opportunities to improve it.
II. Evaluation Framework for War Groups or War Alliances
2.1 Classification of War Involvement by Allied States
The calculation scheme for the intensity of war among nation groups or war alliances largely follows the evaluation framework for national war intensity. Based on the breadth and depth of national involvement in the war, nations within a war alliance are categorized according to different levels of involvement. These categories are: belligerent nations; frontline allies; supporting allies; and background allies. Different levels of involvement intensity are then calculated based on these categories.
2.2 Assessment of the unpredictability of the alliance
Introducing unpredictability assessment (with the expectation of further introduction of computational models).
In the early stages of a war, based on the political context, the risk of shifts in the power of alliances or blocs can be roughly assessed. If the risk level is too high, it can be assumed that the assessment of the intensity of the war effort by the bloc is less accurate and highly volatile. If the risk level is low, it can be assumed that the assessment of the war alliance (bloc) is more accurate.
From a political perspective, some unpredictability is, in fact, within the predictable range. When a less rigorous risk assessment of these factors is possible, risks can be categorized as follows: changes in the stance of background allies; potential opposition states; potential opposition states; and potential allies of the enemy.
However, there are also unpredictable factors in the course of war that are completely impossible to predict in the early stages. For example, political and military geniuses can only be identified and confirmed during the course of war. They cannot be discovered before or in the early stages of a war. Sudden natural disasters, geographical disasters, and environmental disasters are also unpredictable factors.
2.3 Assessment of the War Progress
War is a dynamic process; offensive or defensive postures alter a nation’s war-fighting capabilities. The acquisition and loss of land and resources change the baseline for assessment. As war progresses, the number of nations joining or withdrawing from the conflict constantly shifts. The depth and breadth of a nation’s involvement in the war also change with its development. Dynamic assessment of war is both important and essential.
| Table 3: Alliance and Group War Intensity (Dynamic) Assessment Items | ||||
| Defense mode | Geographical factors provide strong practical support for the defending side. | Automatically enters total war mode to increase the nation’s war capabilities. | Generally, it possesses a political environment that prioritizes escalating the war effort. | Only the country where the war takes place experiences a defensive effect. Other allies do not have their defensive effects calculated. |
| belligerent countries
(Intervention coefficient 1) |
Comprehensive and direct involvement in the combat process | Sharing the same political goals or even the same or similar philosophical goals with allies. | The country enters a state of war | The entire national economy and organizational structure were geared towards the objectives of war. |
| Frontline allies
(Intervention coefficient 0.6) |
No direct involvement in the war | Sharing the same political goals as allies | The country has not entered a state of war. | The nation mobilized its full political resources to support the ongoing war and its allies. |
| Support allies
(Intervention coefficient 0.3) |
No intervention in the war | Having similar political goals or demands with allies | The country was basically not involved in war. | Providing tangible military and economic support to allies at the government level. |
| Background Allies
(Intervention coefficient 0.15) |
We will not intervene in the war at this stage. | Because of practical factors, there are quite close political and economic ties with the countries that are at war. | They will not proactively get involved in war. | Provide economic and political background support to allies in the war. This support will not incur any losses. |
| Predictable ‘unpredictability’ | Background Allies’ Changing Stance
(National power valuation coefficient: 0.15) |
Possible opposition countries
(Countries whose political and economic gains are closely related to the outcome of war) (National power value: 0.2) |
Potential opposition countries
(Existing non-hostile states with differing political stances) (National power is counted as 0.25) |
potential enemy allies
(Countries whose political and economic stances are close to those of their adversaries) (National power value: 0.3). |
| Unpredictability
(No calculation method available) |
The political and military genius effects that followed the course of the war | The sudden change in the philosophical views and political leanings of ordinary people | Unpredictable sudden political events | Unpredictable geographical or environmental disasters |
| The defender in war | The defender’s assessment of the intensity of war remained unchanged over the following year. Overall strength was calculated in conjunction with the defense coefficient. | Territory and finances lost by a defending nation are not counted as lost within two years of their loss. | If the attacking side is defeated and becomes the defending side, the lost territory and finances of the country will not be considered lost within one year. | Once the defender becomes the attacker, the defensive effect that was previously included in the calculation model disappears. |
| The attacking side in war | The war intensity score remained unchanged for one year before the war. | The occupied territory and its finances are included in the calculation factors of the party after four years of stable occupation. | The defensive effect is not calculated if the attacking side retreats into its own territory within 6 months. | Six months after the attacking side was defeated and became the defending side, the defensive effect was calculated in the new environment. |
2.4 Updates and Replacements of War Alliances
As the war progresses and changes, the roster of participating nations in a war alliance may change, but the core operational mechanism remains the same; this can be considered an update to the war alliance. If the core operational mechanism changes, it is considered a replacement of the war alliance. In the event of a major update or replacement of a war alliance, the naming and calculation of the alliance will undergo significant changes accordingly.
III. Ranking of National War Intensity under Static Conditions
Based on the National War Intensity Assessment System, the following is a ranking of national war intensities.
| Table 4: Static Nation War Strength Table | ||||
| Sort | nation | National War Intensity | National defense intensity | Country Code |
| 1 | China | 888.9 | 1955.6 | CHN |
| 2 | USA | 820.6 | 1805.3 | USA |
| 3 | Russian Federation | 722.2 | 1588.9 | RUS |
| 4 | India | 607.8 | 1094.1 | IND |
| 5 | Brazil | 515.8 | 722.1 | BRA |
| 6 | Canada | 482.8 | 675.9 | CAN |
| 7 | Australia | 474.1 | 663.7 | AUS |
| 8 | Saudi Arabia | 443.7 | 798.7 | SAU |
| 9 | Japan | 433.0 | 606.2 | JPN |
| 10 | Indonesia | 424.2 | 593.9 | IDN |
| 11 | Iran | 413.4 | 578.8 | IRN |
| 12 | U.K. | 412.6 | 907.7 | GBR |
| 13 | Germany | 396.0 | 554.4 | DEU |
| 14 | France | 394.7 | 868.4 | FRA |
| 15 | Turks | 384.2 | 537.9 | TUR |
| 16 | Mexico | 382.8 | 535.9 | MEX |
| 17 | Argentina | 380.3 | 532.4 | ARG |
| 18 | Algeria | 379.6 | 531.4 | DZA |
| 19 | Egypt | 371.5 | 520.0 | EGY |
| 20 | Pakistan | 365.5 | 657.8 | PAK |
| 21 | Italy | 362.8 | 507.9 | ITA |
| 22 | South Korea | 354.2 | 495.9 | KOR |
| 23 | Spain | 353.1 | 494.3 | ESP |
| 24 | South Africa | 342.4 | 479.4 | ZAF |
| 25 | Kazakhstan | 341.9 | 478.7 | KAZ |
| 26 | Colombia | 341.7 | 478.3 | COL |
| 27 | Thailand | 339.7 | 475.5 | THA |
| 28 | Vietnam | 333.3 | 466.6 | VNM |
| 29 | Nigeria | 332.3 | 465.2 | NGA |
| 30 | Poland | 313.3 | 438.6 | POL |
| 31 | Bangladesh | 305.3 | 427.4 | BGD |
| 32 | Venezuela | 304.7 | 426.5 | VEN |
| 33 | Chile | 303.0 | 424.1 | CHL |
| 34 | Democratic Republic of Congo | 302.8 | 423.9 | COD |
| 35 | Ukraine | 298.3 | 417.6 | UKR |
| 36 | Norway | 296.2 | 414.7 | NOR |
| 37 | Angola | 296.0 | 414.5 | AGO |
| 38 | Peru | 295.4 | 413.5 | PER |
| 39 | Tanzania | 293.1 | 410.4 | TZA |
| 40 | Sweden | 289.9 | 405.8 | SWE |
| 41 | Ethiopia | 285.4 | 399.6 | ETH |
| 42 | the Philippines | 281.2 | 393.7 | PHL |
| 43 | Morocco | 277.1 | 388.0 | MAR |
| 44 | Malaysia | 276.2 | 386.6 | MYS |
| 45 | Iraq | 276.2 | 386.6 | IRQ |
| 46 | Sudan | 275.9 | 386.3 | SDN |
| 47 | Libya | 274.8 | 384.8 | LBY |
| 48 | Myanmar | 271.4 | 380.0 | MMR |
| 49 | Uzbekistan | 270.2 | 378.3 | UZB |
| 50 | Netherlands | 269.1 | 376.7 | NLD |
| 51 | United Arab Emirates | 266.4 | 373.0 | ARE |
| 52 | Bolivia | 265.1 | 371.2 | BOL |
| 53 | Romania | 264.8 | 370.8 | ROU |
| 54 | Chad | 261.3 | 365.8 | TCD |
| 55 | Niger | 258.1 | 361.3 | NER |
| 56 | Mongolia | 256.7 | 359.4 | MNG |
| 57 | Finland | 256.7 | 359.4 | FIN |
| 58 | Mali | 254.5 | 356.2 | MLI |
| 59 | Kenya | 252.3 | 353.3 | KEN |
| 60 | Portugal | 250.1 | 350.1 | PRT |
| 61 | Oman | 249.9 | 349.9 | OMN |
| 62 | Greece | 248.7 | 348.1 | GRC |
| 63 | Mozambique | 245.0 | 343.0 | MOZ |
| 64 | Switzerland | 244.2 | 341.9 | CHE |
| 65 | Turkmenistan | 243.4 | 340.7 | TKM |
| 66 | North Korea | 241.6 | 434.8 | PRK |
| 67 | Israel | 240.4 | 432.8 | ISR |
| 68 | Paraguay | 239.6 | 335.4 | PRY |
| 69 | New Zealand | 239.1 | 334.7 | NZL |
| 70 | Cameroon | 238.2 | 333.5 | CMR |
| 71 | Belarus | 236.5 | 331.1 | BLR |
| 72 | Afghanistan | 236.4 | 331.0 | AFG |
| 73 | Namibia | 235.1 | 329.2 | NAM |
| 74 | mauritania | 233.0 | 326.3 | MRT |
| 75 | Zambia | 231.3 | 323.8 | ZMB |
| 76 | Ecuador | 231.0 | 323.4 | ECU |
| 77 | Uganda | 229.8 | 321.8 | UGA |
| 78 | Austria | 228.2 | 319.5 | AUT |
| 79 | Zimbabwe | 226.9 | 317.7 | ZWE |
| 80 | Botswana | 226.2 | 316.7 | BWA |
| 81 | South Sudan | 225.5 | 315.7 | SSD |
| 82 | Czech Republic | 224.4 | 314.2 | CZE |
| 83 | Belgium | 224.0 | 313.6 | BEL |
| 84 | Yemen | 223.4 | 312.7 | YEM |
| 85 | Azerbaijan | 223.1 | 312.3 | AZE |
| 86 | Hungary | 222.7 | 311.7 | HUN |
| 87 | Cambodia | 221.2 | 309.6 | KHM |
| 88 | Ireland | 221.0 | 309.4 | IRL |
| 89 | Côte d’Ivoire | 220.3 | 308.4 | CIV |
| 90 | Cuba | 219.4 | 307.1 | CUB |
| 91 | Madagascar | 218.2 | 305.5 | MDG |
| 92 | Ghana | 217.3 | 304.2 | GHA |
| 93 | Denmark | 217.3 | 304.2 | DNK |
| 94 | Syria | 215.5 | 301.7 | SYR |
| 95 | Jordan | 213.6 | 299.1 | JOR |
| 96 | Tunisia | 211.8 | 296.5 | TUN |
| 97 | Qatar | 208.3 | 291.7 | QAT |
| 98 | Republic of Congo | 208.2 | 291.4 | COG |
| 99 | papua new guinea | 207.9 | 291.1 | PNG |
| 100 | Bulgaria | 207.5 | 290.5 | BGR |
| 101 | somalia | 206.2 | 288.6 | SOM |
| 102 | Senegal | 205.4 | 287.5 | SEN |
| 103 | Uruguay | 204.2 | 285.9 | URY |
| 104 | Croatia | 204.0 | 285.6 | HRV |
| 105 | Burkina Faso | 204.0 | 285.5 | BFA |
| 106 | Central African Republic | 203.9 | 285.5 | CAF |
| 107 | Singapore | 202.4 | 283.3 | SGP |
| 108 | Sri Lanka | 201.7 | 282.3 | LKA |
| 109 | Laos | 201.0 | 281.4 | LAO |
| 110 | Serbia | 200.3 | 280.5 | SRB |
| 111 | Kuwait | 198.5 | 277.9 | KWT |
| 112 | Slovakia | 198.2 | 277.5 | SVK |
| 113 | Guinea | 196.0 | 274.4 | GIN |
| 114 | Tajikistan | 194.6 | 272.5 | TJK |
| 115 | Dominican Republic | 194.3 | 272.0 | DOM |
| 116 | Honduras | 193.9 | 271.5 | HND |
| 117 | Guatemala | 193.5 | 271.0 | GTM |
| 118 | Nepal | 193.2 | 270.4 | NPL |
| 119 | Lithuania | 192.4 | 269.3 | LTU |
| 120 | Gabon | 191.9 | 268.7 | GAB |
| 121 | Nicaragua | 186.4 | 260.9 | NIC |
| 122 | Kyrgyzstan | 182.6 | 255.6 | KGZ |
| 123 | Georgia | 182.0 | 254.7 | GEO |
| 124 | Benin | 177.7 | 248.8 | BEN |
| 125 | Latvia | 176.3 | 246.8 | LVA |
| 126 | Guyana | 175.5 | 245.7 | GUY |
| 127 | Malawi | 173.8 | 243.3 | MWI |
| 128 | Rwanda | 172.2 | 241.0 | RWA |
| 129 | Estonia | 167.6 | 234.7 | EST |
| 130 | Togo | 167.5 | 234.5 | TGO |
| 131 | slovenia | 167.4 | 234.4 | SVN |
| 132 | Panama | 164.5 | 230.3 | PAN |
| 133 | Armenia | 164.4 | 230.2 | ARM |
| 134 | costa rica | 163.5 | 228.9 | CRI |
| 135 | Albania | 163.3 | 228.6 | ALB |
| 136 | Surinam | 162.9 | 228.1 | SUR |
| 137 | El Salvador | 162.1 | 227.0 | SLV |
| 138 | Haiti | 160.4 | 224.6 | HTI |
| 139 | Iceland | 159.9 | 223.9 | ISL |
| 140 | Liberia | 159.4 | 223.2 | LBR |
| 141 | Bosnia and Herzegovina | 157.1 | 219.9 | BIH |
| 142 | Cyprus | 156.9 | 219.7 | CYP |
| 143 | Bahrain | 155.6 | 217.9 | BHR |
| 144 | Sierra Leone | 155.2 | 217.2 | SLE |
| 145 | Lebanon | 154.6 | 216.5 | LBN |
| 146 | Brunei | 154.2 | 215.9 | BRN |
| 147 | Hong Kong, China | 152.8 | 213.9 | HKG |
| 148 | Equatorial Guinea | 152.0 | 212.8 | GNQ |
| 149 | Swatini | 151.4 | 212.0 | SWZ |
| 150 | Moldova | 151.1 | 211.6 | MDA |
| 151 | North Macedonia | 148.3 | 207.6 | MKD |
| 152 | Luxembourg | 145.2 | 203.2 | LUX |
| 153 | Jamaica | 144.9 | 202.9 | JAM |
| 154 | Burundi | 142.1 | 198.9 | BDI |
| 155 | Lesotho | 138.1 | 193.3 | LSO |
| 156 | Fiji | 136.0 | 190.4 | FJI |
| 157 | Bhutan | 135.9 | 190.2 | BTN |
| 158 | Trinidad and Tobago | 135.1 | 189.1 | TTO |
| 159 | Guinea-Bissau | 134.7 | 188.6 | GNB |
| 160 | Djibouti | 134.4 | 188.2 | DJI |
| 161 | East Timor | 128.3 | 179.6 | TLS |
| 162 | Montenegro | 128.1 | 179.4 | MNE |
| 163 | Bahamas | 128.0 | 179.1 | BHS |
| 164 | Belize | 125.6 | 175.8 | BLZ |
| 165 | Gambia | 124.3 | 174.0 | GMB |
| 166 | Mauritius | 117.4 | 164.4 | MUS |
| 167 | cape verde | 112.1 | 157.0 | CPV |
| 168 | malta | 111.6 | 156.2 | MLT |
| 169 | Barbados | 104.5 | 146.3 | BRB |
| 170 | Seychelles | 99.7 | 139.6 | SYC |
Part Four: Ratings and Outcome Predictions for the European War Alliance
4.1 Progress and predictions of the European war between the L1 and L2 lines.
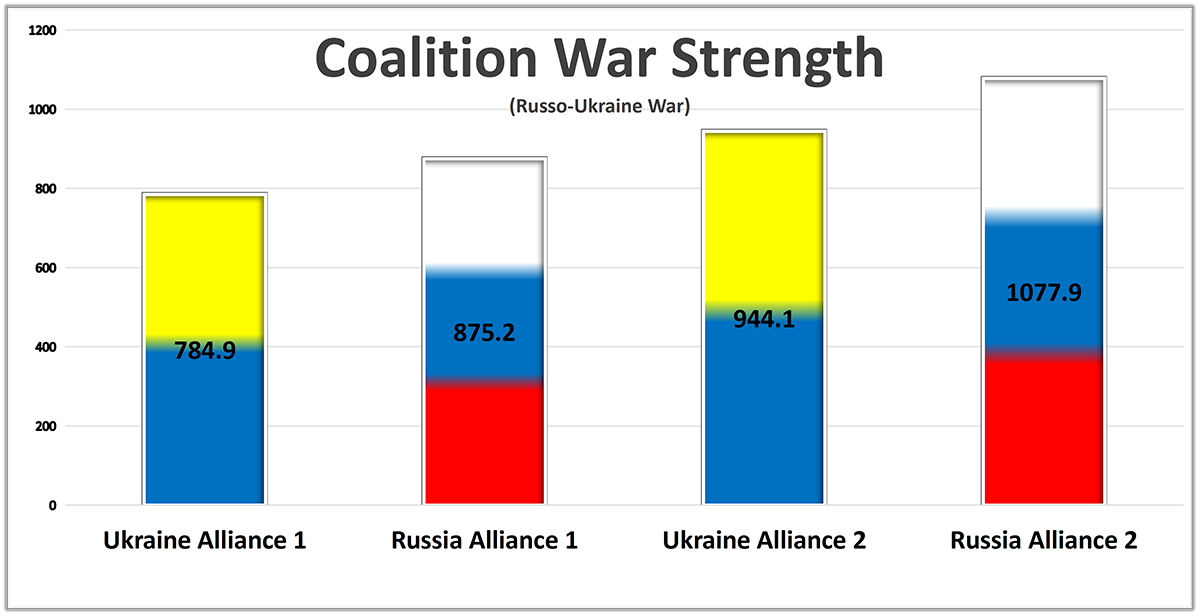
Figure 1. Comparison of Alliance War Strength in the European theater
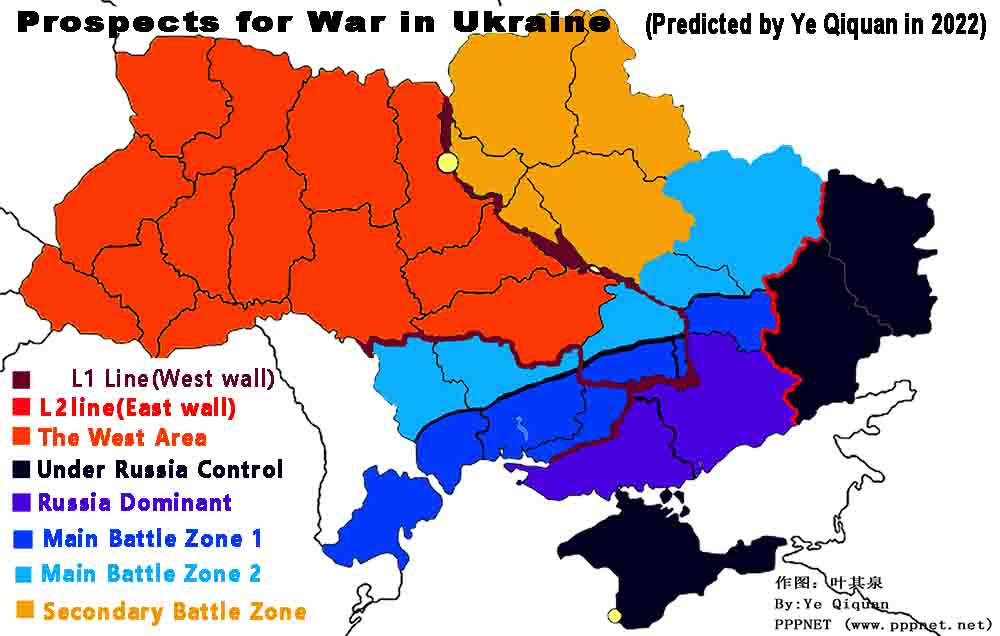
Figure 2. Trend of the Russia-Ukraine War
4.1.1 War Alliances when the battlefield is between L1 and L2 lines
Referring to the L1 and L2 lines of the limitation wall for the Russia-Ukraine war as defined in Ye, Qiquan’s article[1], when the Russia-Ukraine war was being fought east of the Dnieper River (L1 line) and west of the Donbas (L2 line), the composition of the Ukrainian war alliance and the Russian war alliance was as follows.
| Table 5. Structure of the Ukraine Union | ||
| Ukraine Alliance 1: (Battleground located east of L1 line: War intensity 784.9) | ||
| belligerent countries | Ukraine | Triggers a defensive effect; coefficient 1.4 |
| Frontline allies | Lithuania, Poland | National war capability is valued at 60%. |
| Support allies | Czech Republic, France, Germany, Israel, United Kingdom, United States. | National war capability is valued at 30%. |
| Background Allies | Australia, Austria, Belgium, Bulgaria, Canada, Croatia, Denmark, Estonia, Finland, Greece, Hungary, Iceland, Ireland, Italy, Japan, South Korea, Latvia, Luxembourg, Moldova, Netherlands, New Zealand, Norway, Portugal, Romania, Slovakia, Slovenia, Spain, Sweden, Switzerland. | National war capability is valued at 15%. |
| Possible opposition to the country | Some South American countries | Anti-existing imperial forces |
| Potential opposing countries | African countries | Anti-existing imperial forces |
| Potential allies of the other party | Most Arab countries | Anti-existing imperial forces |
| Table 6: Russian Union-I Structure | ||
| Russian Alliance 1: (Battleground location west of L2 line: War intensity 875.2) | ||
| belligerent countries | Russia | |
| Frontline allies | National war capability is valued at 60%. | |
| Support allies | Belarus | National war capability is valued at 30%. |
| Background Allies | China, Cuba, India, Iran, North Korea, Saudi Arabia, Serbia, Syria, United Arab Emirates. | National war capability is valued at 15%. |
| Possible opposition to the country | The four Central Asian countries, Mongolia | Aftermath of the collapse of the empire |
| Potential opposing countries | Kazakhstan, Turkey | Multiple factors |
| Potential allies of the other party | Philippines, Mexico | Political and economic basis |
4.1.2 Alliance War Intensity When the Battlefield is Located Between L1 and L2 Lines
| Table 7: Alliance War Intensity When the Battlefield is Located Between L1 and L2 Lines | |||
| Ukraine Union 1 | Russian Union 1 | Benchmark score | |
| Geographical factors scoring | 232.7 | 314.9 | /300 |
| Demographic factors scoring | 68.0 | 84.7 | /120 |
| Political scoring | 94.8 | 107.9 | /100 |
| History bonus | 0 | 10 | /10 |
| Military factors scoring | 134.3 | 122.4 | /120 |
| Agricultural industry capacity | 42.5 | 52.9 | /80 |
| Industrial capacity | 82.2 | 72.7 | /110 |
| Service industry capabilities | 32.9 | 22.2 | /40 |
| Arms input capability | 97.4 | 87.5 | /120 |
| Alliance War Strength Total | 784.9 | 875.2 | |
Figure 3: Alliance War Intensity Map with Battlefronts Located Between L1 and L2 Lines
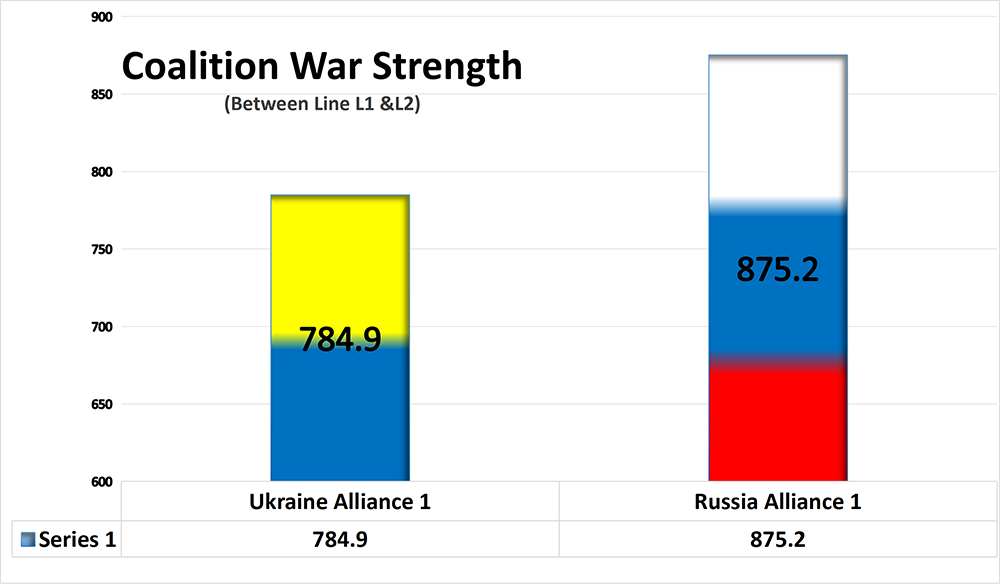
Referring to Table 7, Figures 2 and 3, the following inferential conclusions can be drawn.
- The overall intensity of the war between the Russian and Ukrainian allies is greater than that between the Ukrainian and Ukrainian allies.
- Between L1 and L2 lines, it can be inferred that the Russian alliance has a greater chance of winning than the Ukrainian alliance;
- The Ukrainian coalition surpasses the Russian coalition in military capabilities, arms procurement capacity, agricultural production capacity, and industrial production capacity. In the long term, the Ukrainian coalition is likely to gain a decisive advantage in war through its military and industrial strengths.
- The Russian alliance is stronger than its adversaries in terms of geographical, demographic, and political factors. In the long term, Russia can leverage its demographic and political advantages to gain a competitive edge in war.
4.1.3 Predicted War Outcomes When the Battlefield is Located Between Lines L1 and L2
(1. According to the conclusions of the war intensity assessment system, the Russian alliance has the advantage in this large area between the L1 and L2 lines;
(2. Russia’s ability to forcefully occupy the deep blue zone on Figure 2 (Crimea, Luhansk, and Dönetsk) is beyond doubt, because the eastward expansion of the front line beyond the L2 line will trigger the formation of “Russian Union II”.
(3. There is a very high probability that Russia will strongly occupy the dark blue and light blue areas on Figure 2 (Crimea, Luhansk, Dönetsk, most of Zaporizhzhia Oblast, and most of Kherson Oblast).
(4. There is a high probability that Russia will occupy the dark blue, light blue, and lake blue areas on Figure 2 (Crimea, Luhansk, Dennetsk, Zaporizhzhia Oblast, Kherson Oblast, most of Mykolaiv Oblast, and part of Odessa Oblast).
(5. The worst-case scenario for Ukraine is the loss of all its territory east of the Dnieper River;)
(6. It is unlikely that Russia will cross the L1 line westward. This is because crossing the L1 line westward would trigger the Ukrainian coalition to upgrade to “Ukrainian Coalition II,” thereby causing a reversal of power in the war.)
4.2 Progress and Predictions of the European War Beyond the L1 Line
4.2.1 Changes to the War Alliance Structure (Updated)
If the war between Russia and Ukraine crosses the L1 line westward, it will severely damage the interests of the US-led coalition, thereby prompting the escalation of “Ukraine Alliance I” into “Ukraine Alliance II.” This change will significantly upgrade the warfighting force composition of the Ukrainian alliance, while the composition of the Russian alliance will remain largely unchanged. This will lead to a reversal of the balance of power on the Russian-Ukrainian battlefield, with Ukraine gaining a military advantage and the Russian alliance becoming weaker.
| Table 8: Ukraine Union Structure II: | ||
| Ukraine’s second alliance structure: (frontline westwards L1) 944.1 | ||
| belligerent countries | Ukraine, | Triggers a defensive effect; coefficient 1.4 |
| Frontline allies | Czech Republic, France, Lithuania, Poland, United Kingdom, United States | National war capability is valued at 60%. |
| Support allies | Australia, Austria, Belgium, Bulgaria, Canada, Croatia, Denmark, Estonia, Finland, Germany, Iceland, Ireland, Israel, Italy, Japan, South Korea, Latvia, Luxembourg, Moldova, Netherlands, New Zealand, Norway, Portugal, Romania, Slovakia, Slovenia, Spain, Sweden, Switzerland. | National war capability is valued at 30%. |
| Background Allies | Greece, Hungary | National war capability is valued at 15%. |
| Possible opposition to the country | Some South American countries | Anti-existing imperial forces |
| Potential opposing countries | African countries | Anti-existing imperial forces |
| Potential allies of the other party | Most Arab countries | Anti-existing imperial forces |
4.2.2 Alliance War Intensity When the Battlefield is West of Line L1
| Table 9: Alliance War Intensity West of Line L1 | |||
| Ukraine Union II | Russian Union I | Benchmark score | |
| Geographical factors scoring | 285.9 | 314.9 | /300 |
| Demographic factors scoring | 80.8 | 84.7 | /120 |
| Political scoring | 105.5 | 107.9 | /100 |
| History bonus | 0 | 10 | /10 |
| Military factors scoring | 159.7 | 122.4 | /120 |
| Agricultural industry capacity | 51.7 | 52.9 | /80 |
| Industrial capacity | 100.6 | 72.7 | /110 |
| Service industry capabilities | 40.7 | 22.2 | /40 |
| Arms input capability | 119.2 | 87.5 | /120 |
| Alliance War Strength Total | 944.1 | 875.2 | |
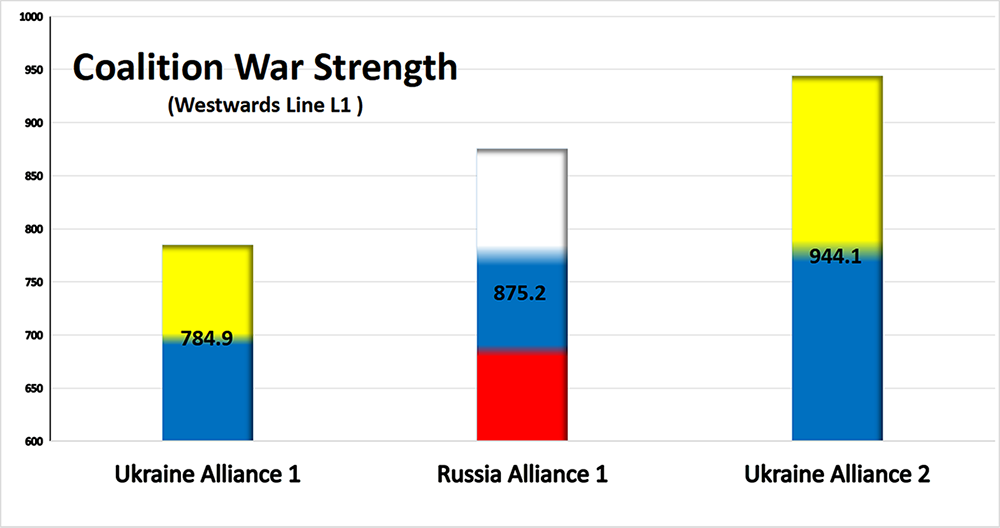
Figure 4: Alliance War Strength westwards Line L1
As can be seen from the data in Figure 4 and Table 9, once the formation of the Ukrainian Union II was triggered, the war capability represented by the intensity of the war immediately reversed. The Ukrainian Union leads the Russian Union in overall score, as well as in military capability, arms investment, industrial output, and service industry.
4.2.3 Inspiring predictions about the outcome of the war following “Ukraine Alliance II”
(1. The Ukrainian Union II’s war power is significantly stronger than that of the Russian Union, which may lead to Russia being retaliated against and forced to withdraw from the territories it has already occupied;
(2. There is a very high probability that Russia will be compressed back into the dark blue and light blue areas shown in Figure 2 (Crimea, Luhansk, Dennetsk, most of Zaporizhzhia Oblast, and most of Kherson Oblast), and will engage in a long-term standoff with the US bloc there, because this line is very much in the long-term interests of the US bloc.)
(3. Russia is still very likely to continue to occupy the dark blue, light blue, and lake blue areas shown in Figure 2 (Crimea, Luhansk, Dennetsk, Zaporizhzhia Oblast, Kherson Oblast, most of Nikolaev Oblast, and part of Odessa Oblast). This is because this line of confrontation still serves the long-term interests of the US bloc.
(4. The US bloc generally does not pursue a single outcome. This is to compress Russia to the east of the L2 line. Once the battlefield extends beyond the east of the L2 line, it will trigger the formation of “Russian Alliance II,” thereby reversing the balance of power on the battlefield once again.)
4.3 Progress and Forecasts of the European War East of Line L2
Once the war is pushed eastward and crosses the L2 line, the various political and military alliances on the battlefield will once again undergo tremendous upheaval and change. This will be characterized by a heightened sense of national defense in Russia and a restructuring of new war alliances.
4.3.1 Changes in the structure of war alliances
(1. The Donbas region east of the L2 line has special political significance for Russia. Since 2014, the Donbas region east of the L2 line has effectively possessed autonomy beyond that of the Kosovo region;)
(2. Regardless of the origins of the Minsk agreements, this series of international agreements effectively confirms that Luhansk and Dönetsk have autonomy beyond the Kosovo region;
(3. Although four regions have declared referendums to join the Russian Federation, the turbulent history of Luhansk and Dönetsk is clearly different from that of Kherson and Zaporizhzhia.
(4. Assuming Russia could tolerate the loss of Kherson and Zaporizhzhia in the war, the loss of Luhansk and Dönetsk would certainly fuel Russian national defensive sentiment.)
(5. Assuming that the low-probability event comes true and the battlefield is pushed to the east of the L2 line, it will inevitably trigger the formation of the Russian Alliance II.
4.3.2 Alliance War Intensity When the Battlefield is East of L2 Line
Russian Union II
| Table 10: Russian Alliance II: (Frontline extends east of L2) (1077.9) | ||
| belligerent countries | Russia | It triggers a defensive effect with a coefficient of 2.2. |
| Frontline allies | Belarus | National war capability is valued at 60%. |
| Support allies | China, North Korea, Iran | National war capability is valued at 30%. |
| Background Allies | Cuba, India, Saudi Arabia, Serbia, Syria, United Arab Emirates | National war capability is valued at 15%. |
| Possible opposition to the country | The four Central Asian countries, Mongolia | Aftermath of the collapse of the empire |
| Potential opposing countries | Kazakhstan, Turkey | Multiple factors |
| Potential allies of the other party | Philippines, Mexico | Political and economic reasons |
| Table 11: Alliance War Intensity East of L2 Line | |||
| Ukraine Union II | Russian Union II | Benchmark score | |
| Geographical factors scoring | 285.9 | 405.0 | /300 |
| Demographic factors scoring | 80.8 | 101.6 | /120 |
| Political scoring | 105.6 | 115.0 | /100 |
| History bonus | 0 | 10 | /10 |
| Military factors scoring | 159.7 | 155.0 | /120 |
| Agricultural industry capacity | 51.7 | 64.5 | /80 |
| Industrial capacity | 100.6 | 90.8 | /110 |
| Service industry capabilities | 40.7 | 27.7 | /40 |
| Arms input capability | 119.2 | 108.3 | /120 |
| Alliance War Strength Total | 944.1 | 1077.9 | |
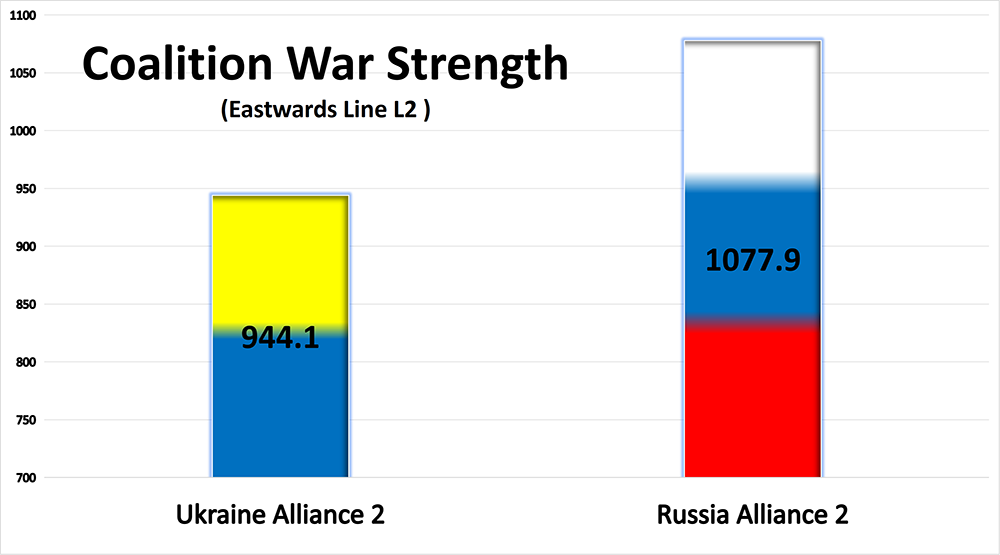
4.3.3 Predicting the trajectory of the war following “Russian Alliance II”
(1. The “Russian Alliance II” will trigger another shift in battlefield capabilities. The Russian alliance will once again gain the upper hand in warfare.)
(2. The formation of “Russia Union 2” will trigger significant political turmoil as China joins Russia’s ranks of supporters. This could have a cascading political effect in Europe.)
(3. The political effects of “Russian Alliance II” are very likely to trigger further changes in the composition of subsequent war alliances, thereby triggering a real pan-European war.
(4. The composition of alliances and the intensity of war in the pan-European war require further research.)
5. Summary
The application of high-powered, wide-area weapons is becoming increasingly feasible. The rapid deployment and movement of armed forces are becoming more sophisticated. Group warfare and total war models are returning to political reality. Under these new circumstances, there is a need for new tools to assess a nation’s overall war capability and its group’s total war capability. This is the initial motivation behind this paper’s proposal of a “National War Intensity” assessment system.
In this assessment system, geographical factors, demographic factors, organizational capabilities, military capabilities, and economic capabilities are listed as the most important warfighting assets. Geographical factors, in particular, are elevated to a previously unrecognized level and are considered a component of a nation’s most powerful deterrent force.
According to this assessment system, the countries with the strongest overall national war capabilities are: China, the United States, Russia, India, Brazil, Canada, Australia, Saudi Arabia, Japan, and Indonesia.
Based on the extended calculations of this assessment system, the war intensity of various war alliances participating in European wars can be calculated. Given the current structure of the Ukrainian alliance, its overall war intensity is weaker than that of the Russian alliance. This should be the fundamental reason why Ukraine is constrained in the wars in central and southern Ukraine.
The current stalemate in this region stems from the fact that the Russian-led coalition does not possess an overwhelming advantage in the intensity of the war. The Ukrainian coalition holds advantages in military equipment, armament capabilities, industrial capacity, and service sector capacity. The Ukrainian coalition can gain a war advantage through attrition warfare and industrial depletion. The Russian coalition, on the other hand, possesses advantages in geographical factors, organizational strength, and population. Russia can gain further battlefield advantages through attrition warfare and the support of relative political stability.
If Russia attempts to push its gains west of the L1 line, it will trigger an upgrade and renewal of the Ukrainian coalition. The upgraded Ukrainian coalition would be significantly more intense than Russia’s current coalition, potentially leading to Russian setbacks in central and southern Ukraine.
However, the eastward advance of the new Ukrainian alliance can hardly extend beyond the L2 line. This is because once the front line crosses the L2 line, it would trigger an upgrade and renewal of the Russian alliance, leading to another reversal of power.
Applying this assessment system, we can better explain Ye, Qiquan’s predictions about the trajectory of the Russia-Ukraine war made in April, May, and June of 2022. These predictions indicate that the Russia-Ukraine war will be confined to the L1 and L2 lines for a relatively long period of time; Russia will establish as many as seven autonomous governments on Ukrainian territory; and Russia will not suffer a military defeat until at least the end of 2026 [1,2,3,4].
References:
- Ye, Qiquan. Predicted the border wall in the Russia-Ukraine war as early as April 26, 2022. PPPNET, webpage: https://pppnet.net/en/early-prophecy-on-confined-walls-in-russia-ukraine-war/
- Ye, Qiquan. Three Theoretical Ceasefire Lines in the Russo-Ukrainian War. PPPNET, Webpage: https://pppnet.net/en/three-possible-ceasefire-lines-in-russia-ukraine-war/
- Ye, Qiquan. Whose War? Winners and Losers in the Russia-Ukraine War. PPPNET, 2023. Webpage: https://pppnet.net/en/players-winning-or-losing-from-russia-ukraine-war-2/
- Ye, Qiquan. The border wall from the Russia-Ukraine war will remain functional until at least the end of 2026. PPPNET, 2023. Webpage:https://pppnet.net/en/confined-walls-still-work-in-russia-ukraine-war-by-2026-2/
Other data sources involved in model computation
World Development Indicators. World Bank. 2022. https://www.databank.worldbank.org/
Countryreports 2022. Countryreports.Org. 2022. https://www.countryreports.org/
The World Factbook. Central Intelligence Agency. 2023. https://www.cia.gov/the-world-factbook/
2023 Military Strength Ranking. Global Firepower. 2023. https://www.globalfirepower.com/countries-listing.php
Global Food Security Index(GFSI) 2022. The Economist. 2023. https://impact.economist.com/sustainability/project/food-security-index/
2022 Report. Global Innovation Index. 2023. https://www.globalinnovationindex.org/gii-2022-report
Global Hunger Index Scores by 2022 GHI Rank. Global Hunger Index. 2023. https://www.globalhungerindex.org/ranking.html